How to Know Which Application Is Using Internet in Windows 10
Get Free Scanner and check your computer for errors
Fix It NowTo fix found issues, you have to purchase the full version of Combo Cleaner. Free trial available. Combo Cleaner is owned and operated by Rcs Lt, the parent company of PCRisk.com read more.
How to Find Out What Programs Are Using Internet Bandwidth Using Resource Monitor in Windows 10
If you experience a slow Internet connection and can't download or upload, you might want to check for activity in the system background, specifically in the networking area. This article will show you how to check which programs are hogging your Internet bandwidth.

In addition to the possibility of background processes causing the problem, a change in Internet performance can be caused by several different factors.
If there are no problems with your Internet service provider, router, etc., you should check which applications or programs use your Internet bandwidth. Apps or programs could be using some (or even all) Internet bandwidth without your knowledge.
Fortunately, a built-in utility in Windows 10 called Resource Monitor, also known as Resmon, provides access to information about the programs using the Internet. Resource Monitor can be found in Task Manager (and provides information that Task Manager does not provide). It displays a dashboard with information about the presence and use of resources such as disk, memory, CPU, and network.
The network section displays processes with network activity, network activity itself, TCP connections, and 'listening ports.' Follow this guide in which we describe how to access Resource Monitor, how to use it, and how to find out which programs are slowing down your connection by being active in the system background.
Video Showing How to Check What Programs Are Using the Internet:
Table of Contents:
- Introduction
- How to Find Out What Programs Are Using Your Internet Bandwidth
- Video Showing How to Check What Programs Are Using the Internet
Download Computer Malware Repair Tool
It is recommended to run a free scan with Combo Cleaner - a tool to detect viruses and malware on your device. You will need to purchase the full version to remove infections. Free trial available. Combo Cleaner is owned and operated by Rcs Lt, the parent company of PCRisk.com read more.
How to Find Out What Programs Are Using Your Internet Bandwidth
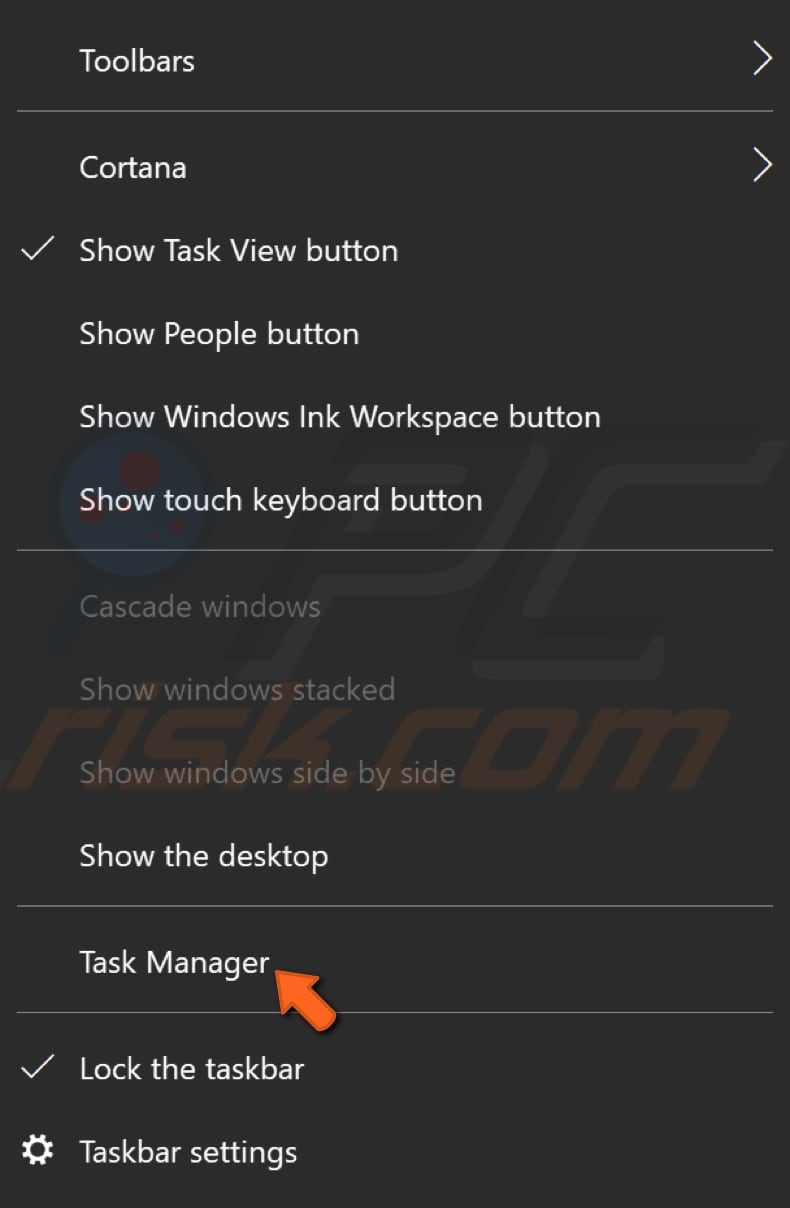
First, open Task Manager by pressing Ctrl + Shift + Esc keys on the keyboard. You can also access Task Manager by right-clicking the Taskbar or the Start menu and selecting "Task manager" from the contextual menu.
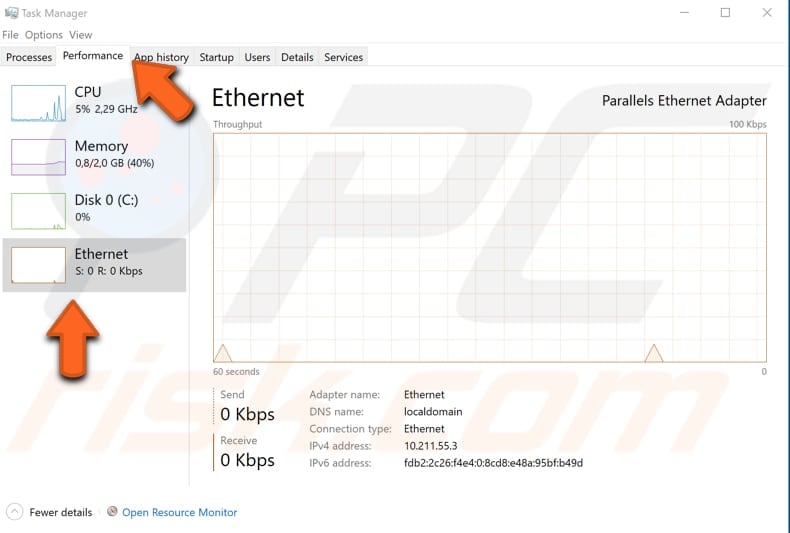
In Task Manager, click the "Performance" tab. You will see an "Ethernet" (or Wi-Fi) section. Select to display a graph with overall send and receive activity on a scale from 0 to 100 Kbps over a 60-second perdiod. Below, the graph displays information about data sent and received, adapter name, connection type, and current IP addresses.
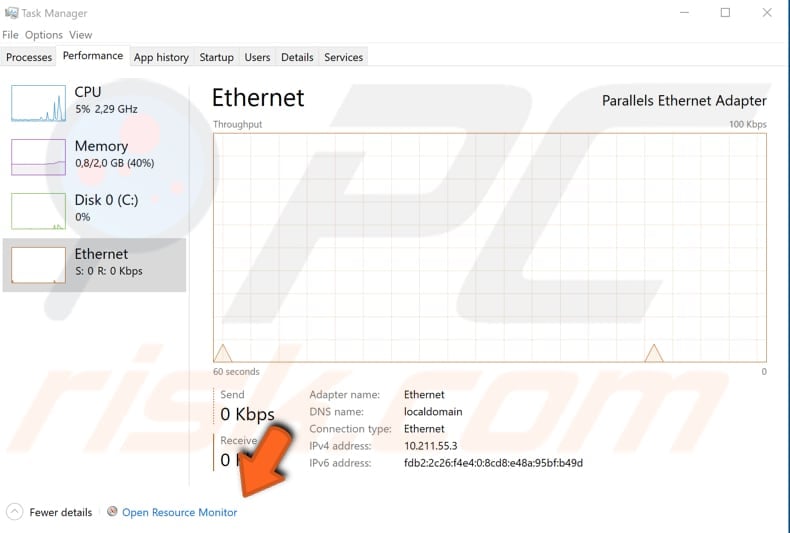
As you can see, this is just basic information and real-time speed statistics, so you need to open Resource Monitor for more details. Click "Open Resource Monitor" at the bottom of the Task Manager window.
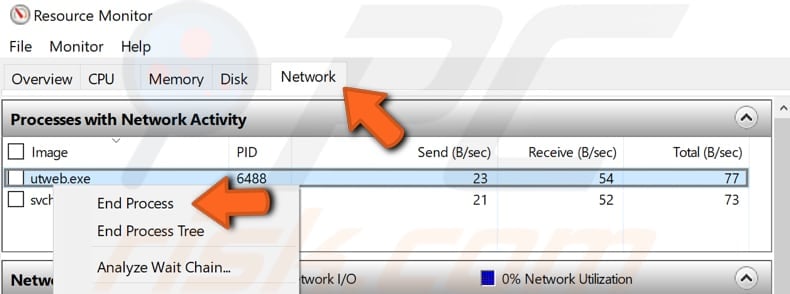
Go to the "Network" tab. You will see four sections: Processes with Network Activity, Network Activity, TCP Connections, and Listening Ports. In the "Processes with Network Activity" tab, you will see the running processes using network resources. Look for the name of the process, "Image". This shows the process executable file name. The "PID" (Process ID) column is followed by the "Send (B/sec)" and "Receive (B/sec)" columns, which represent the number of sent and received bytes.
The "Total" tab shows the total network activity generated by that particular process. We are interested in the "Receive (B/s)" information. If a process uses too much Internet bandwidth, you can close it by right-clicking on it and selecting "End Process" from the contextual menu.
Note that a svchost.exe process running in this tab is normal - it is used by various applications to interact with the Windows operating system. We recommend that you keep it running.
In the "Network Activity" section, you will see identical tabs with an additional one called "Address". This tab displays the address to which a process is connected. You can see that there are two boxes, green and blue. "Network I/O" and "Network Utilization".
The first displays current total utilization, while the second displays exactly how loaded the network is. If there is a suspicious program (or programs) connected to the Internet, we recommend that you run a malware scan.
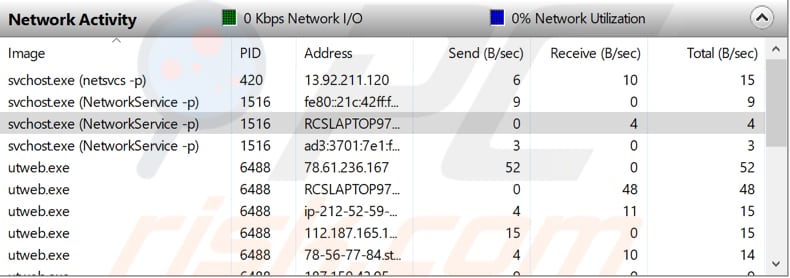
The "TCP Connections" section consists of six tabs: "PID", "Local Address", "Local Port", "Remote Address", "Remote Port", "Packet Loss (%)", and "Latency (ms)". The local Address tab shows which network adapter and IP address might have been overcrowded.
The Local Port tab displays on which ports there is communication activity. The Remote Address tab displays one part of the communication stream, while Remote Port displays the other. The "Packet Loss (%)" tab shows the quality of the Internet connection.
The more packet loss is shown, the worse the quality. The "Latency (ms)" tab indicates how much time it takes for data to travel from one point to another. The higher the number, the longer it takes.

The "Listening Ports" section consists of three new tabs not mentioned previously: "Address", "Protocol", and "Firewall Status". The "Address" tab shows the local process on which the process is listening. Some services are tied to specific IP addresses - the tab shows which IP address the process is tied to.
The "Protocol" tab shows the network protocol used by the process. And finally, the "Firewall Status" tab, as its name implies, displays the firewall status. If the firewall is blocking traffic, you will see it in this tab.
 If you suspect that an application or program is using too much Internet bandwidth, go to Resource Monitor and find all information you might need to address the problem.
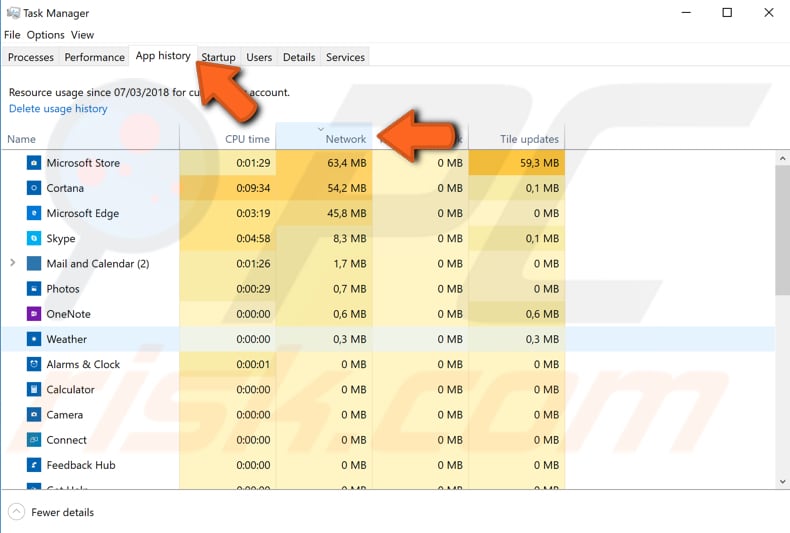
The Task Manager's "App history" tab is another simple method to gain information about apps and their network usage. However, it does not display all apps that might be using Internet bandwidth.
Rather, it is relevant to Microsoft apps that are built-in or downloaded from Microsoft Store. Therefore, Resource Monitor is a more informative tool.
We hope that this article helped provide the basics of Resource Monitor and check which apps or programs are using Internet bandwidth and slowing down your connection. If there is something you would like to add, please leave a comment in the comments section below.
Share:

Rimvydas Iliavicius
Researcher, author
Rimvydas is a researcher with over four years of experience in the cybersecurity industry. He attended Kaunas University of Technology and graduated with a Master's degree in Translation and Localization of Technical texts. His interests in computers and technology led him to become a versatile author in the IT industry. At PCrisk, he's responsible for writing in-depth how-to articles for Microsoft Windows.

▼ Show Discussion